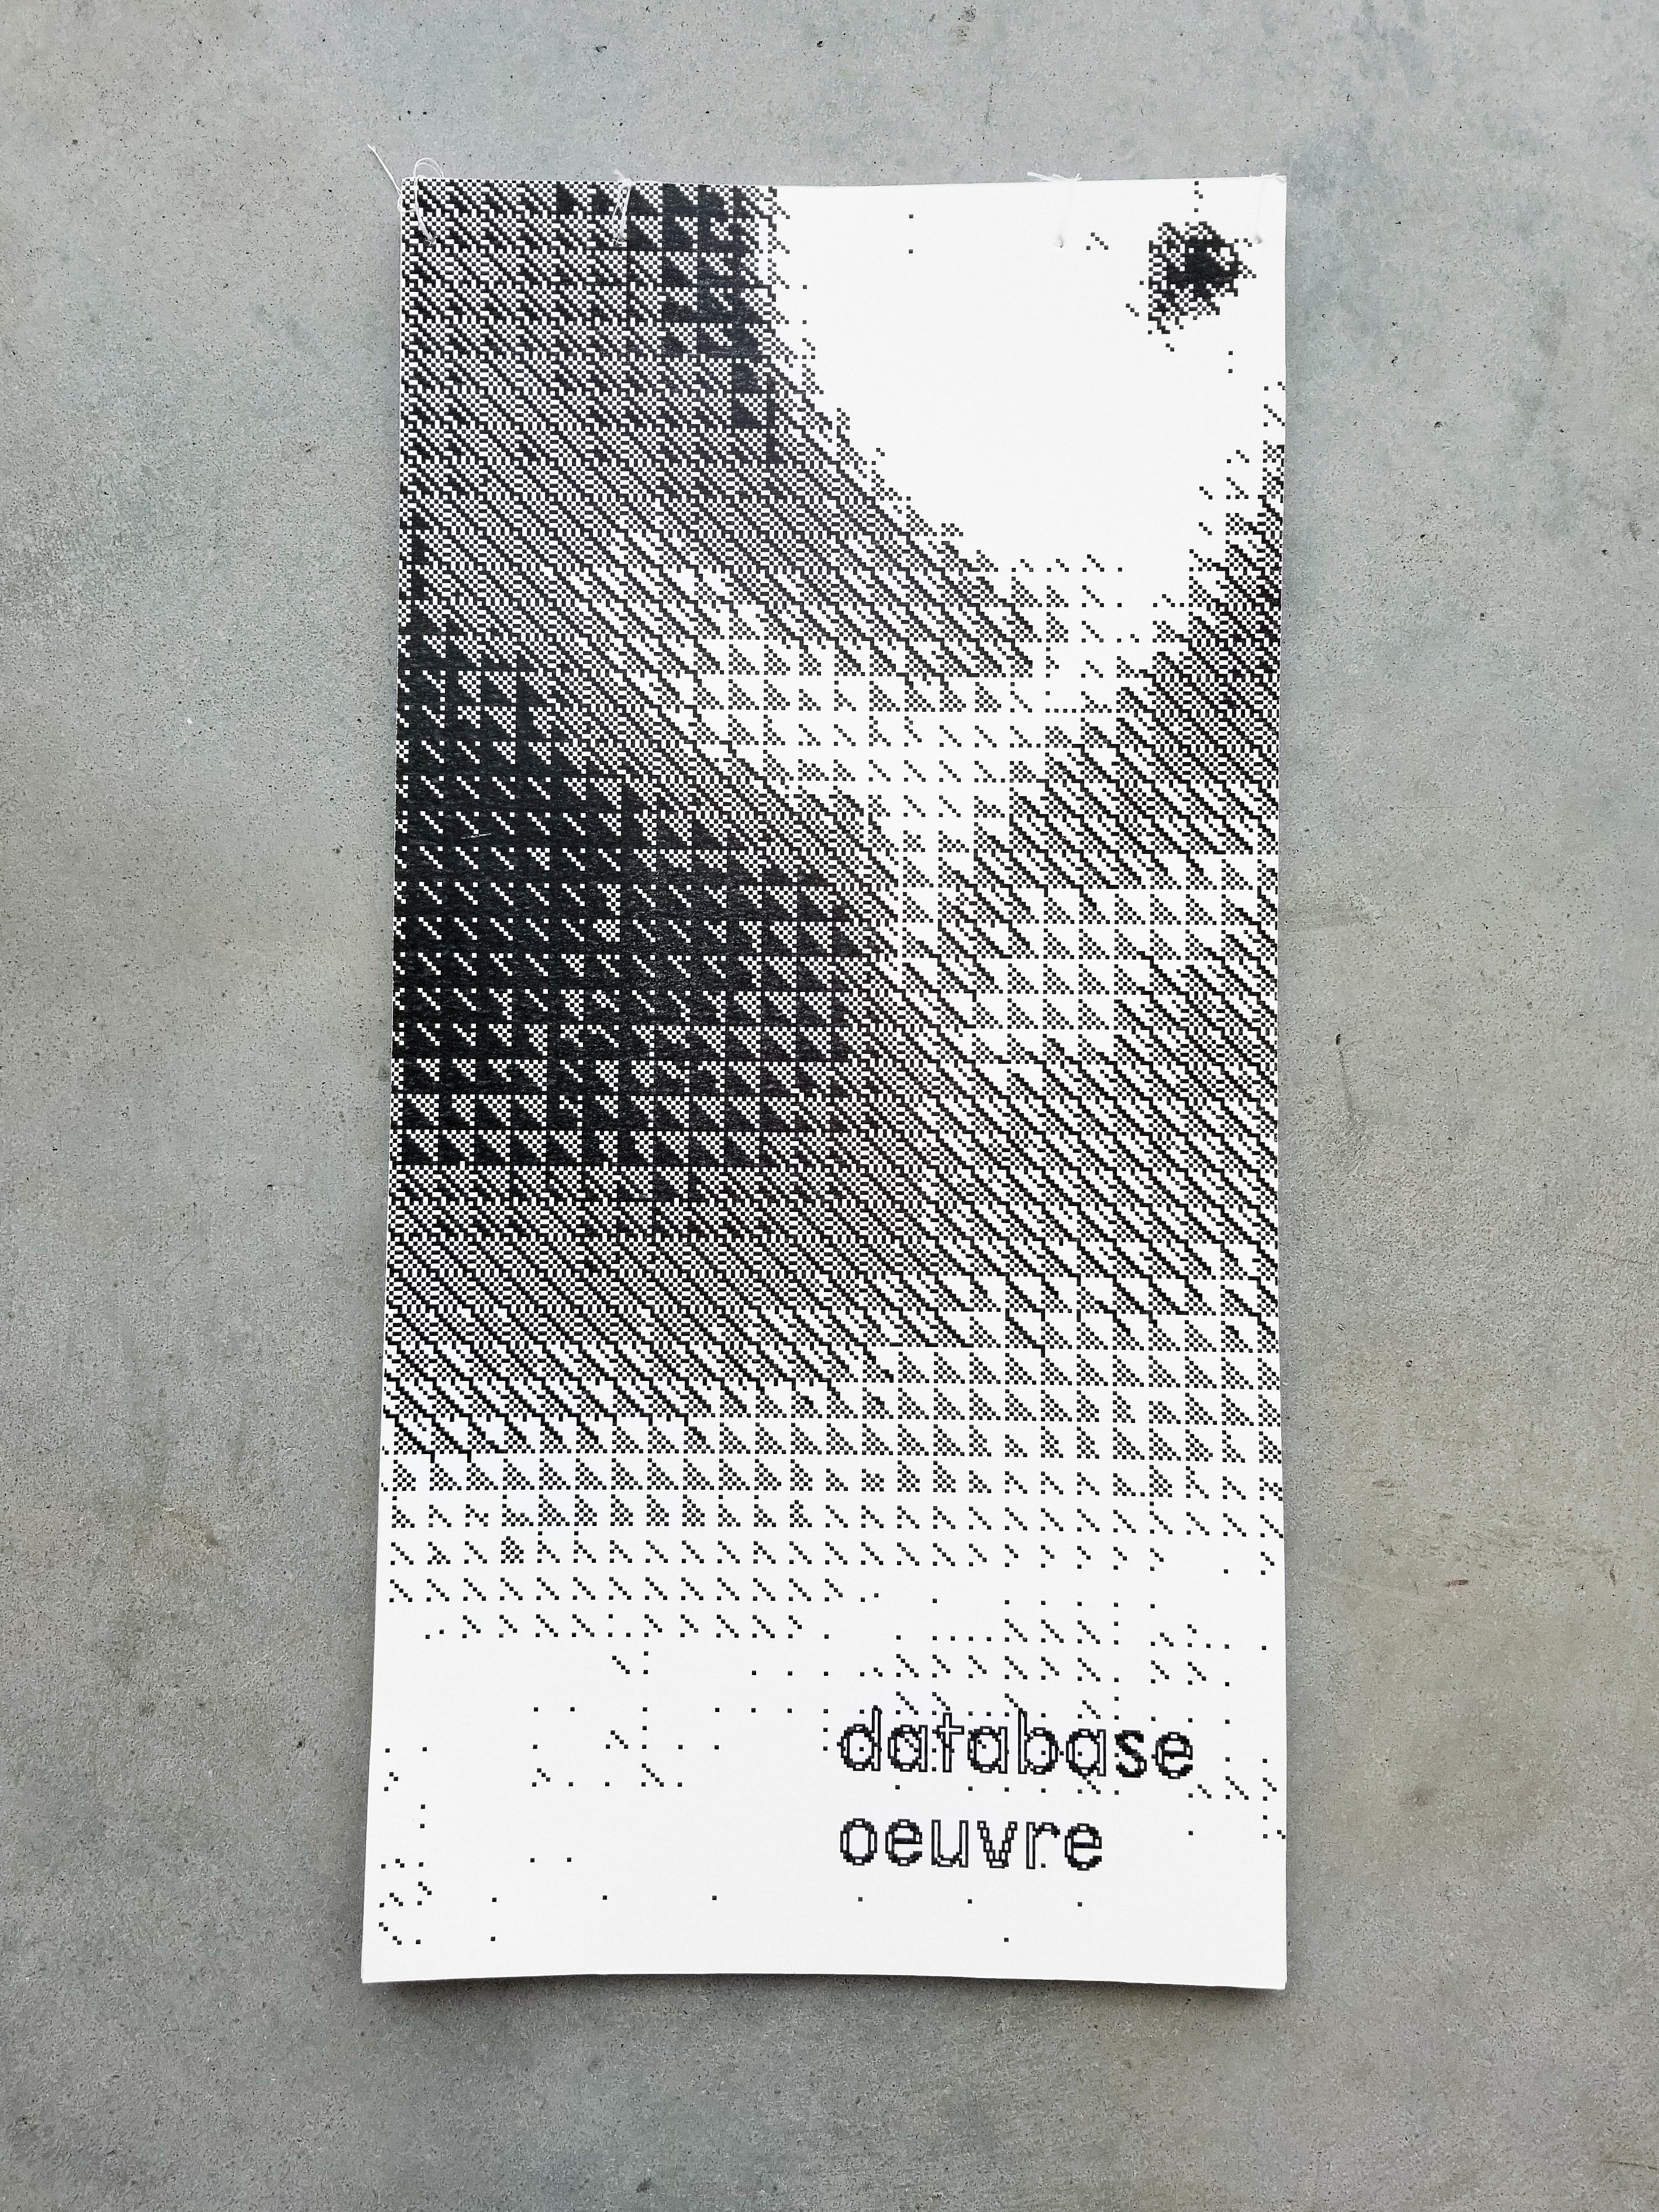
Database Oeuvre
Data Visualization of Painter's Oeuvres
| Year | 2018 |
| Kind |
|
| Tools |
|
| Website |
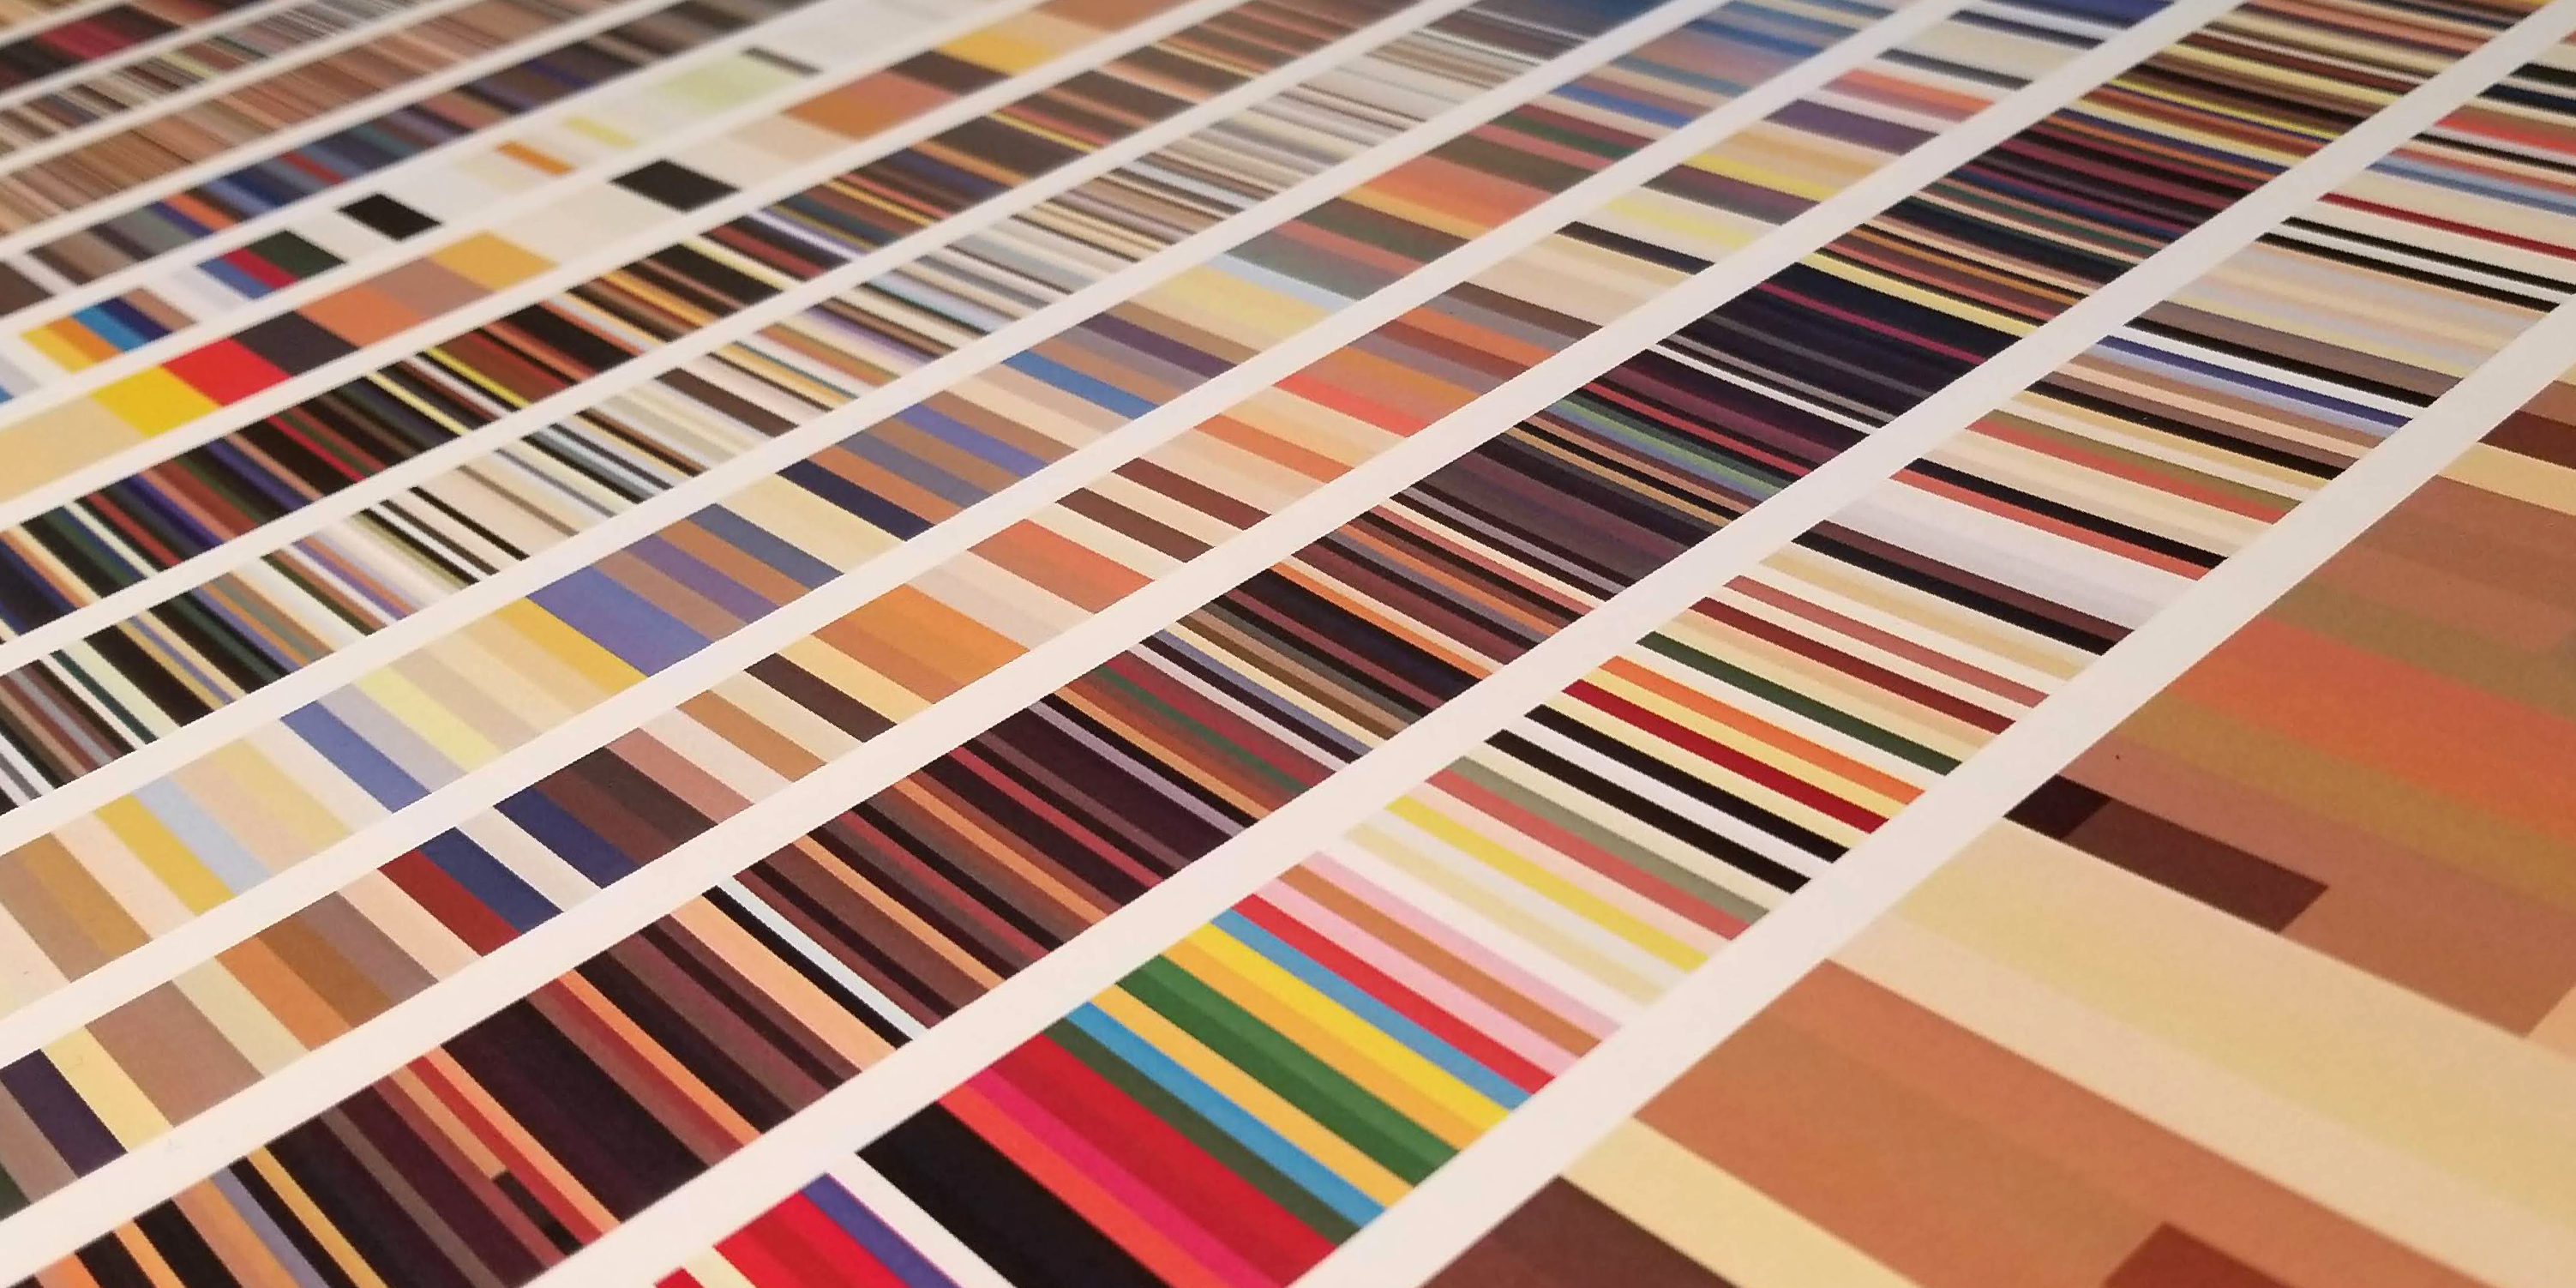
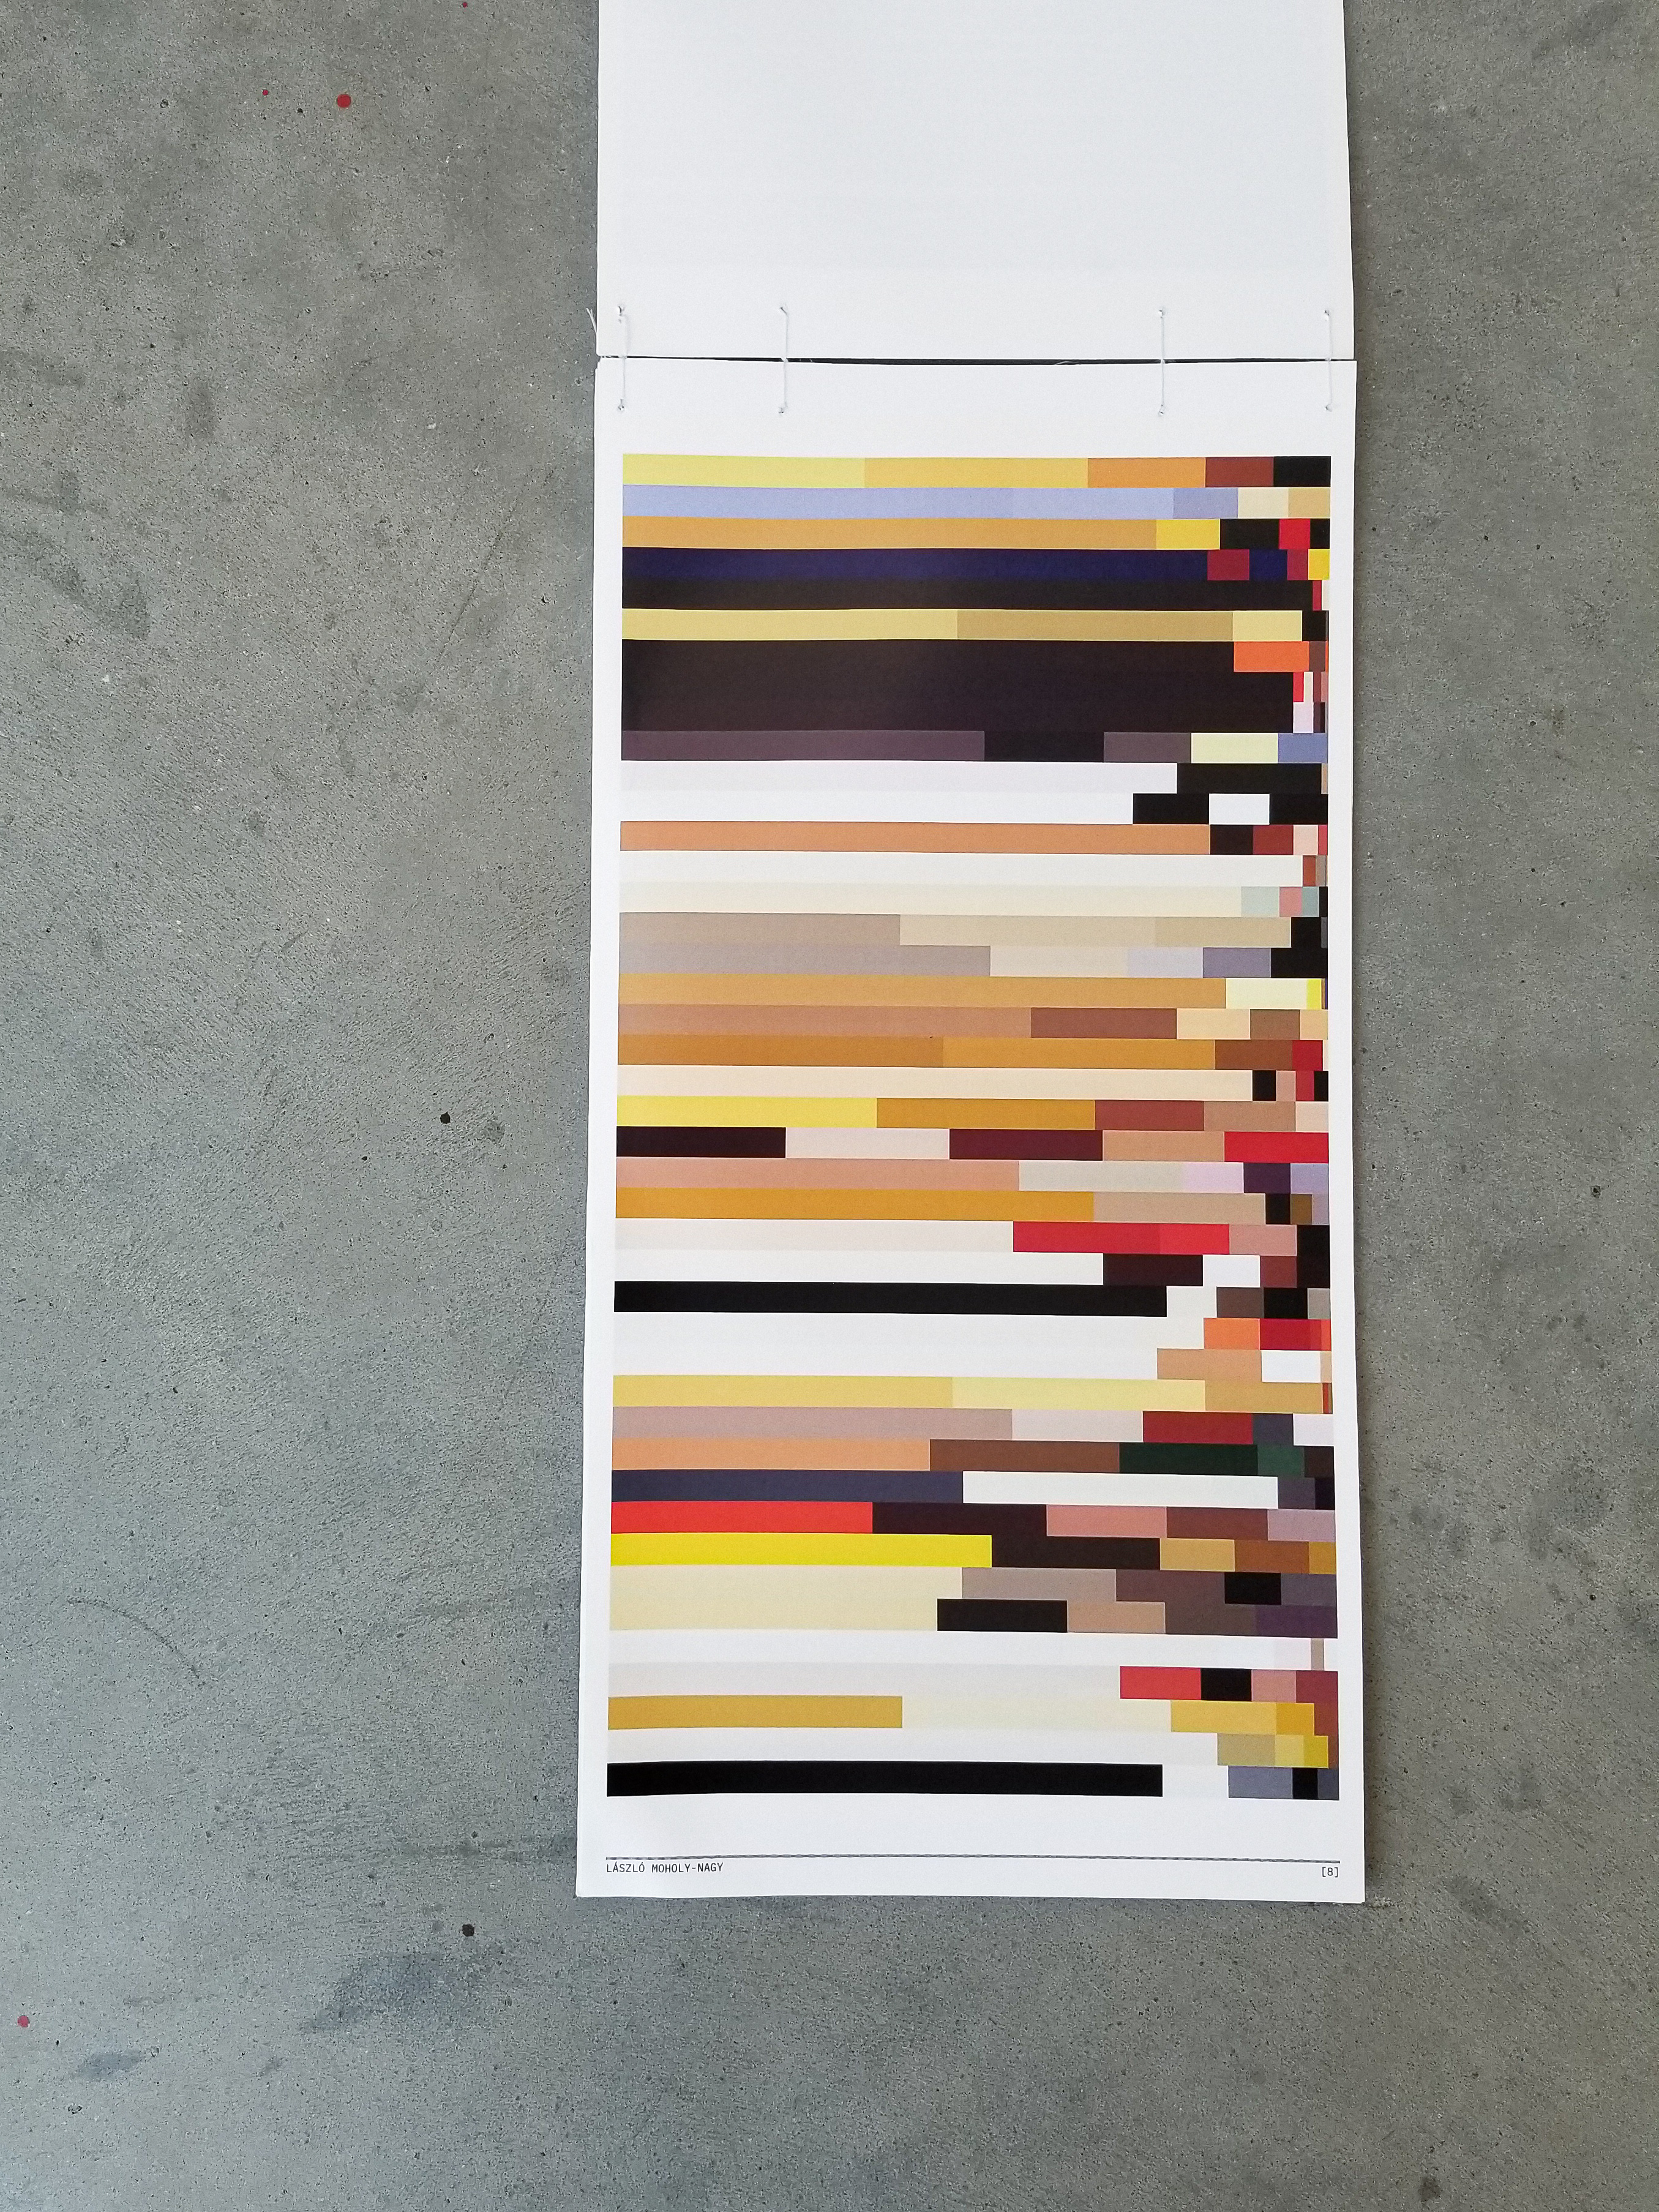
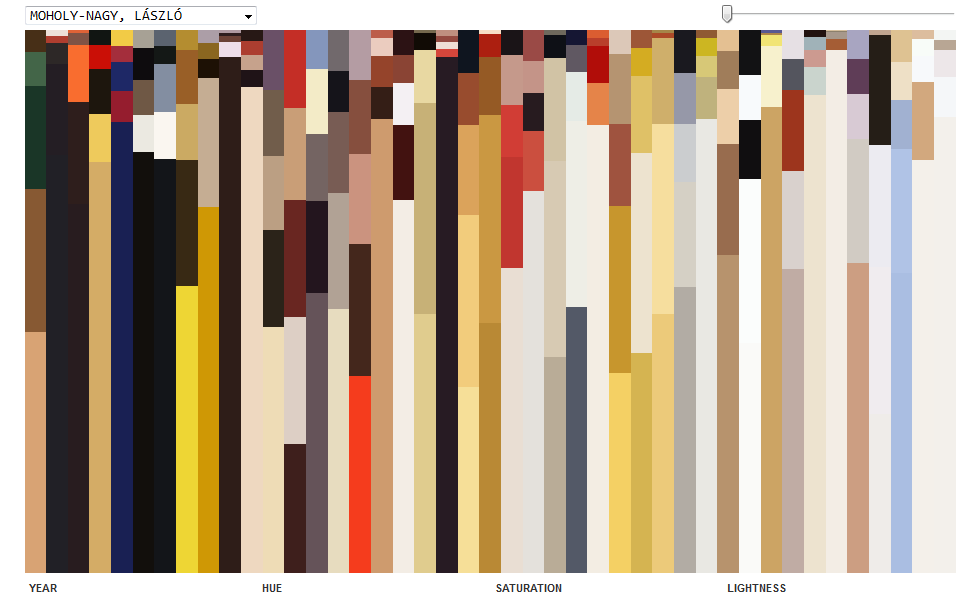
Database Oeuvre visualizes the the bodies of work produced by select painters, by way of reducing and chronologically presenting their artwork as quantized distributions of color. Database Oeuvre takes two forms: a book and a website. It is partly inspired by Paul Soulellis' essay Search, Compile, Publish.
This project required a multi-stage process of web-scraping, image processing, database building, and data visualization.
Database Oeuvre won first place in the area of design for Knox College's annual Al Young competition in 2019.
I was interested in how digital images are reproduced and transformed across physical and digital media.
This project was presented at HORIZONS, an annual showcase of student-research and -projects at Knox College.
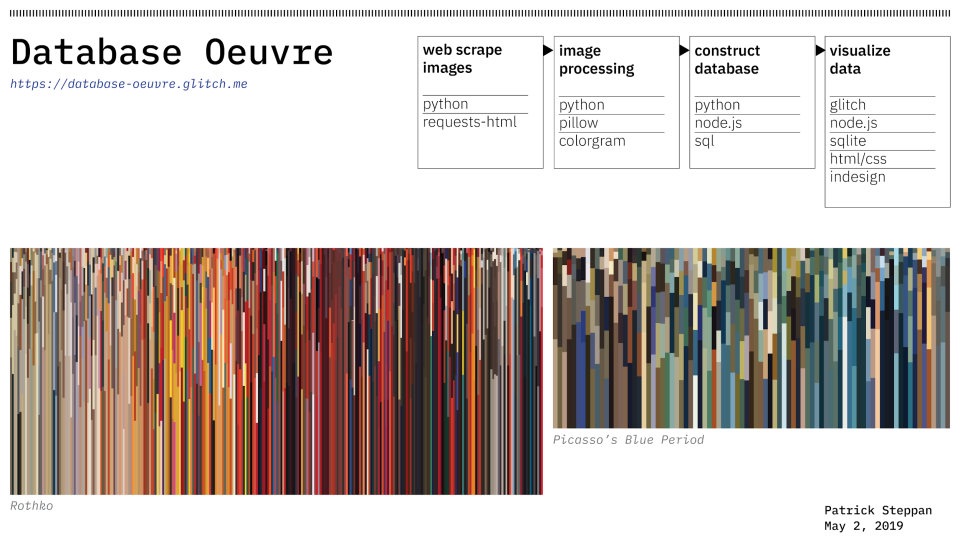
If you're not interested a summary of the process, feel free to skip this part! First, I scraped about 20,000 images and their associated metadata from different online art archives using python and the requests-html library. Then, I used a particular image processing library to analyze the images and find a representation of their palettes. I transformed the data into a SQL database which I could use to generate the book and website. I created the website with vanilla javascript and database queries, its hosted on Glitch. Finally I designed, printed, and bound the book.